
BLOG
How to read your DEXA scan report

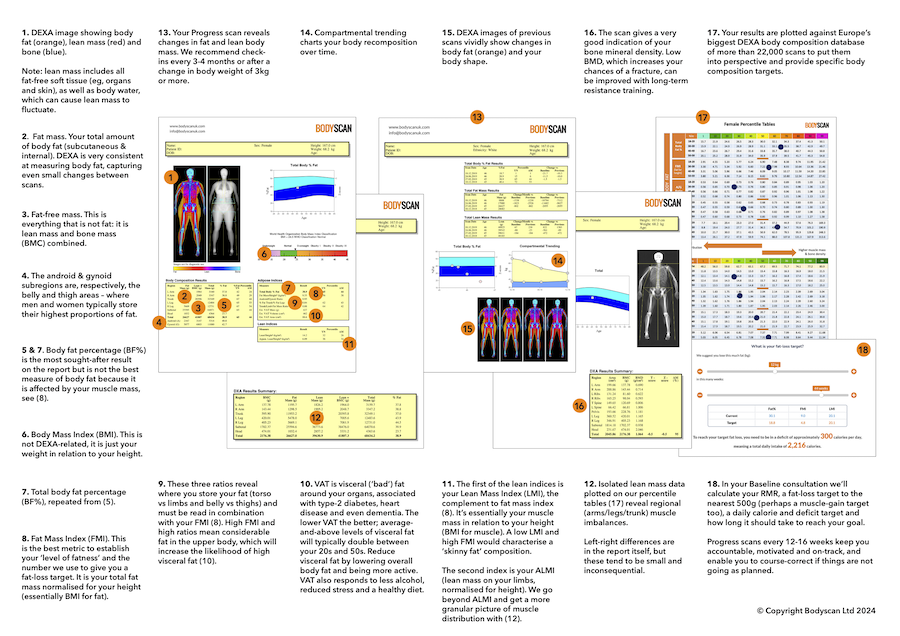
The three-page report from your DEXA body scan is a bewildering mass of numbers – what you might call ‘big data’ – so it’s important to get a clear and comprehensive interpretation of what each number on your DEXA report means.
That’s why, to help you understand your DEXA report, we insist that your first scan is the Baseline DEXA scan, whose detailed face-to-face consultation will explain what each metric means as well as ‘rank’ your results by plotting them against the biggest DEXA dataset in Europe. It’s Bodyscan’s own database, built up over nine years.
Understanding your DEXA results
Everything is relative! Most of the body composition metrics on your first DEXA report will be new to you, so without some sort of comparison data, the results will be meaningless. For example, the best number for recording your ‘level of fatness’ is not your body fat percentage but your ‘fat mass index’, or FMI. But would you know if an FMI of 6.2 is high, low or average?
Without comparison/population data, there is no way of interpreting what your DEXA report says about your body composition or how it sits in relation to other people or what your priority should be – lose fat, gain muscle, or both.
Bodyscan has created a DEXA report ‘infographic’ that helps you understand your DEXA scan report by highlighting the key metrics and explaining them in plain English. Our percentile comparison data sheets enable you to plot your key DEXA metrics and see how you rank in terms of your fat mass and lean mass (essentially muscle), both normalised for height, your bone density and visceral fat.
Your fat distribution is also compared to thousands of others, and Bodyscan’s DEXA tables reveal your muscle distribution across the regions of the body – something that’s not in the report itself and only disclosed by our huge DEXA dataset.
It’s easy to see left-right muscle imbalances of 10% or more (few people are perfectly symmetric) but where we often see bigger disparities is from top to bottom, between arms, legs and trunk. A bodybuilder would typically have an even muscle distribution (demonstrating an aesthetically-balanced lean body mass), whereas a sprint cyclist would have proportionately much more lean mass in the legs than in the arms.
We help you make sense of your DEXA report by imparting our knowledge and experience of 22,000 scans. For example, there are variations in DEXA results that may appear odd at first sight but can be explained by way of sex, age, ethnicity and lifestyle.
Making your DEXA scan easy to read
To interpret your DEXA scan results, the numbers below are perhaps the most important metrics to understand, compare – and perhaps work on! The numbers below refer to the numbers on the Bodyscan DEXA scan infographic.
Number 8 – Fat Mass Index (FMI)
This is how much body fat you carry in relation to your height. It is, essentially, BMI for fat. Bodyscan’s DEXA scan dataset shows that between 4.0 and 6.0 for men, and 5.0 and 7.0 for women might be a good place to be. Whilst subcutaneous fat is not, in itself, unhealthy, it is usually very tightly correlated with visceral fat.
Number 10 – Visceral Fat (VAT)
When it comes to visceral fat, the lower the better. Visceral adipose tissue (VAT) is one of the key health markers on the report because of its links to obesity-related diseases, such as type-2 diabetes, heart disease and stroke. This video helps you interpret your visceral fat result as it appears on a DEXA scan report.
Number 11 – Lean Mass Index (LMI)
Your LMI is the complement of (8) and is essentially your BMI for muscle. Whilst higher muscle mass is regarded by some as a very strong indicator of how long you will live, it’s important to understand that muscle mass varies greatly by sex and ethnicity – and by your fat mass.
Many overweight and obese men see a high LMI and then interpret their DEXA report as positive overall. But while high muscle mass is better than low muscle mass, it is less positive than high body fat and high visceral fat. That’s why it’s important to read all of the DEXA report metrics in context to fully understand your DEXA scan results.
Number 16 – Bone Mineral Density (BMD)
This is what DEXA was invented to measure. Your DEXA body scan gives a very good indication (not a fully diagnosable result) of your bone density. High BMD is better than low BMD because the latter, if it decreases further, can lead to osteopenia, osteoporosis and bone fractures.
Bodyscan helps you understand your DEXA bone result and how you can, over time, increase it. Interpreting your DEXA result in regards to bone density is more meaningful at Bodyscan because we have many thousands of UK-based (not US-based) scan results to compare you to. This video explains the variations in bone density as measured by DEXA scan.
So, in summary, to interpret your DEXA scan results, you need a consultation from experienced practitioners who understand the data and what it means for you as an individual. Without a comparison to a large and local (UK) dataset, your DEXA scan report could be meaningless.