

In his book ‘Outlive’, Dr Peter Attia’s third DEXA scan metric of interest is that of muscle mass (the other two are visceral fat and bone density).
Although we have left it till last in our series of three blogs, it is this DEXA scan measurement that causes Attia the most concern. Indeed, the word ‘muscle’ appears over 200 times in the book (four times more than the other two metrics combined), and two of them are in this emphatic statement:
“Continued muscle loss and inactivity literally puts our lives at risk,” he says. “Seniors with the least muscle mass are at the greatest risk of dying from all causes.”
In an interview he says that muscle mass is a “highly, highly predictive metric of how long you’re going to live.”
As with bone density, Attia quotes a staggering statistic, this time from a Chilean study of 1400 people with an average age of 74. Of those in the lowest quartile for muscle mass, after 12 years about half of them were dead, compared to just 20 percent of those in the highest quartile.
Let’s now look at muscle mass as measured by a DEXA scan.
DEXA breaks body composition into three compartments – fat, bone and what is called ‘lean mass’. Because your lean mass is everything that’s not fat or bone, it includes not just your muscles, but also your organs, ligaments, connective tissue, skin and so on.
It is standard practice, as Attia does, to read lean mass as if it were muscle. For one thing, about half or more of your lean mass actually is muscle, and for another, the lean mass that isn’t muscle (like skin and organs, etc) we don’t expect to change.
Muscle mass, lean mass and fat-free mass
A technical point here – Attia often interchanges Lean Mass and Fat-Free Mass. They are similar but not quite the same.
Lean Mass is just your non-fat soft tissue (mainly muscle and organs), whereas your fat-free mass includes your bones. As you can see from the Bodyscan DEXA scan extract below, because your bone weight is quite small (typically between 1.5-3.5kg), lean mass and fat-free mass are quite close (41.8 and 43.8kg). That said, fat-free mass is usually about 5% more than your lean mass.
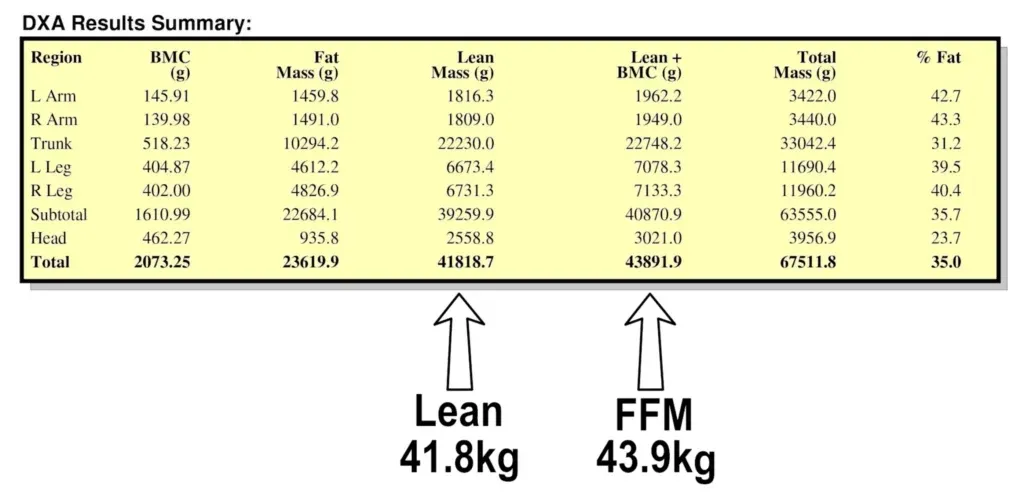
At Bodyscan we use lean mass, which is closer to muscle mass.
Your DEXA scan then calculates two indices for muscle mass, and it is these datapoints that Attia homes in on.
These are known as your Lean Mass Index (LMI) and your Appendicular Lean Mass Index (ALMI) and appear on the front page of your Bodyscan DEXA report. In the extract below, this person’s LMI is 14.1 and their ALMI is 6.50.
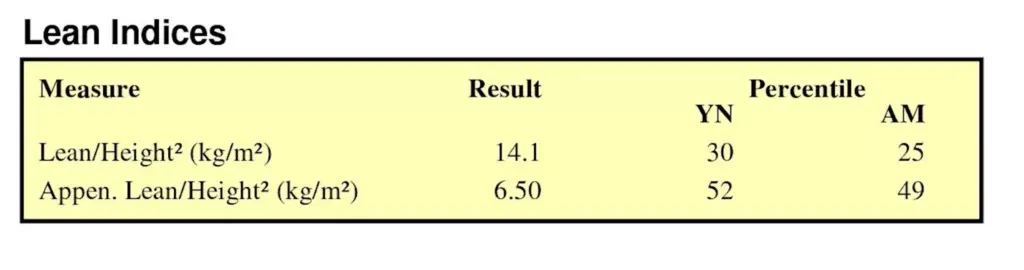
Your Lean Mass Index is your total lean body mass (essentially muscle and organs) divided by your height-squared. You could say it is your “BMI for muscle”. Because it is normalised for height, your LMI is a very good index for putting your total muscle mass into perspective and comparing it to the broader population.
Attia’s second datapoint, your Appendicular Lean Mass Index is the same as LMI but for your limbs only – that is, it excludes your torso.
Attia uses both LMI and ALMI to “triangulate” overall muscle mass but puts more emphasis on ALMI and regards it as a “purer” measure of muscle mass because it is not skewed by the lean mass of your internal organs.
In one interview, Attia despairs about our ignorance of the metric: “Most people don’t know their ALMI,” he says. “They don’t actually know how much muscle mass they have. They don’t know where they stack up for other people their age and sex.”
As for ALMI (limb lean) being a purer measure of muscle mass than LMI (total body lean), Attia has a point, but ALMI is the lean mass of all your limbs, so it too has its own limitation in that it doesn’t separate arms from legs.
At Bodyscan, we go a step beyond ALMI because we reveal your muscle distribution across arms, legs and trunk separately.
If a person has a higher ALMI than LMI, Attia would take as a good thing. But a higher ALMI could come from greater muscle mass in the legs only. As Attia puts a lot of emphasis on grip strength, you can see that ALMI on its own may not be granular enough to make a proper assessment of muscle mass.
What is an even muscle distribution?
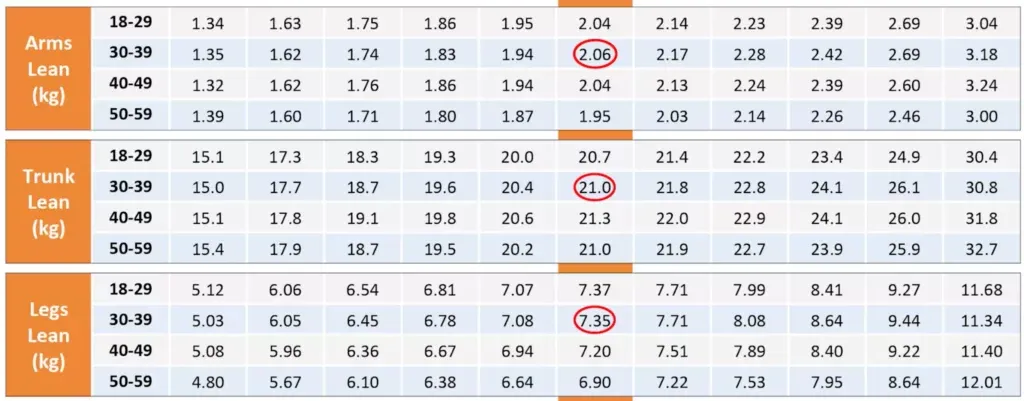
Incidentally, an even muscle distribution is shown by the three lean datapoints for arms, trunk and legs forming a line that is close to the vertical. While the example below shows the data points to be in the middle of the chart (in the 50th percentile line), the vertical configuration can be anywhere on the chart. The circles are plotting actual kilogram amounts from the DEXA report, so we are not interested in wherr they sit on the chart, but in their relative position to each other, the pattern they form.
The circles for someone with higher muscle mass (due to a higher LMI and/or being tall, therefore carrying more absolute total muscle mass) will sit to the right end of the chart (higher kilograms).
Incidentally, when it comes to muscle, it is valid to use the percentiles based on US data within the report. That’s because we all have a natural ‘set point’ when it comes to how much muscle we carry. Those people we might call small, slight, skinny, petite are in the lower percentiles for lean mass, while those in the higher percentiles are what we might call big, solid, chunky or muscular.
It’s that ‘naturalness’ of lean mass that makes US and UK data comparable when we allow for age, sex and ethnicity.
We would never use US percentiles for fat indices because body fat is influenced by lifestyle and diet.
Back to the book and Attia says “it is important to maintain muscle mass at all costs” because if we lose it in later years, it can be impossible to get back.
Attia’s muscle mass target – between ambitious & impossible!
That’s probably why, in an interview, he says he wants his patients’ lean indices to be “north of the 75th percentile” – that is, more muscle for their height than at least 75% of people of the same age, sex and ethnicity.
The morbidity statistics suggest that’s a goal worth aiming for but in Bodyscan’s view it sits somewhere between ambitious and impossible. As mentioned earlier, our natural set point will determine which percentile we start in and our genetic capacity will limit how much muscle we can gain.
Building muscle is achieved by resistance training, usually with heavy weights in a gym. But it is a slow process and gets slower as we reach our genetic limit. The simple fact is that not everyone can reach the 75th percentile.
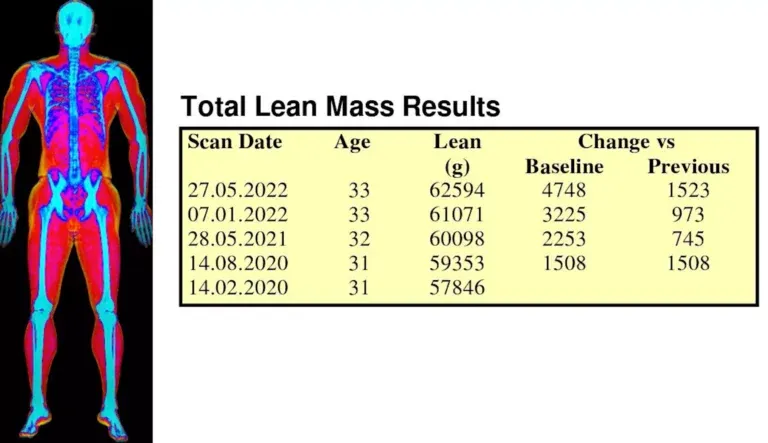
This 31-year-old man (below) may not be at his maximum muscle but it took him 27 months (read the scan dates from the bottom up) to gain just under 5kg of lean mass, taking him from the 53rd to the 73rd percentile, just outside Attia’s preferred target.
From the thousands of male and female scans we’ve done at Bodyscan, we would describe the 80th percentile (not much above Attia’s desired 75th) as equivalent to an amateur bodybuilder.
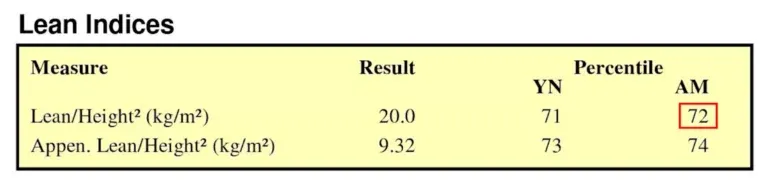
Having said that, this 26-yo natural male bodybuilder (below), who started lifting weights 10 years ago has a lean mass index still only in the 72nd percentile – also short of where Attia wants him to be. (Incidentally, note how his LMI and ALMI percentiles (72 and 74) are very close in percentiles, suggesting an even and aesthetically-balanced physique).
The hard fact is, to get from the 10th to the 75th percentile might take 12kg or more muscle gain for a man and 8kg or more for a woman. That’s a lot! The other point worth making about muscle mass is that when you remove the resistance-training programme that got you there, you will lose all your gains, which is why Attia wants us all to weight-train for the rest of our lives.
Attia makes some contradictory statements about muscle mass. In one, he says it peaks as early as our late 20s before beginning a slow steady decline. In another he says muscle mass remains relatively consistent from our 20s and 30s into middle age. The vast majority of Bodyscan’s customers are under 65, and until that age our data suggests lean mass remains fairly static.
But after 65, Attia say, activity levels and muscle mass decline steeply, and even more steeply after 75, which he describes as falling off a cliff. At age 80, he says the average person will have lost 8kg from their peak.
Remember, though, that a DEXA scan measures muscle mass, not strength, and Attia does differentiate the two. He says it’s not enough to build a big chest or arms, your muscles need to be strong, capable of generating force. He concludes it comes down to how much heavy stuff you can carry and refers to carrying as our superpower.
If you are interested in checking your own DEXA scan metrics of muscle mass, visceral fat and bone density, book your first DEXA scan here.